Play Store App Analysis
What actually makes an app succeed on the Play Store? I combined a 3.45 million app historical archive with a fresh 2026 scrape across 10 countries, then rebuilt the whole analysis as plain Python scripts instead of a notebook, with an eye for where the numbers were quietly lying to me.
This project sits on two datasets at very different scales: a public 2022 archive of 3.45 million Play Store apps from 1.14 million developers, used as the long-run baseline, and a fresh 2026 snapshot I scraped myself, 11,176 live apps across ten genuinely different storefronts (US, India, Brazil, Indonesia, Mexico, the UK, Germany, Japan, South Korea, the Philippines). The genre taxonomy matches almost exactly between the two, which is what makes a real 2022-to-2026 comparison possible instead of just two disconnected snapshots.
Everything below is grouped so the chart and the finding it supports sit together: skim the titles, read the caption under whichever one catches your eye.
How it works
Rebuilt entirely as plain Python scripts, not a Jupyter notebook: every analysis theme (market landscape, ratings, monetization, developer concentration, freshness, geography, discoverability) is its own module, orchestrated by one runner script that regenerates every chart and a single self-contained HTML report.
The 3.45 million-row 2022 CSV (1.1GB) is never loaded fully into pandas. Every aggregation, category stats, developer portfolios, CR3 competition share, runs as a DuckDB query straight against the CSV, with results cached to Parquet so a full re-run after the first pass takes seconds, not minutes.
Big tech / pre-installed developers (Google, Meta, Samsung, Microsoft, and similar) are detected with whole-word regex matching and excluded from every competition and opportunity metric. An early substring-matching version mislabeled real companies as big tech; the specifics are in the Technical Breakdown below.
Every chart is deliberately either static (matplotlib/seaborn) or interactive (Plotly), chosen per chart based on whether hovering for an exact value actually helps, e.g. dense scatters and Lorenz curves are interactive with legend-based show/hide toggles for the big-tech-vs-indie comparison, while clean category rankings stay static.
Country-level storefront data (same ~11k apps, ten localized storefronts) surfaced a real localization effect: identical apps get rated differently by country, and curated top-grossing/top-selling charts favor some categories far more than raw app count alone would predict.
Technical Breakdown
Nineteen charts pulled straight from the analysis pipeline's output, not staged. A mix of static charts and interactive ones (hover for exact values, and where noted, click the legend to toggle between views). One methodology note before the numbers: every competition metric below excludes big tech and pre-installed publishers (Google, Meta, Samsung, and the like), since they aren't competition an indie developer can realistically take share from. Catching my own mistake on that filter was the most useful thing I did on this project: an early version used plain substring matching and quietly mislabeled real companies as big tech, "Vertex Corporation" and "Cognex Corporation" got flagged for containing "x corp," anything with "Operations" in its name got flagged for containing "opera." Whole-word regex matching fixed it. Both the bug and the fix are preserved in the code.
A store of 3.45 million apps, run by a handful of categories
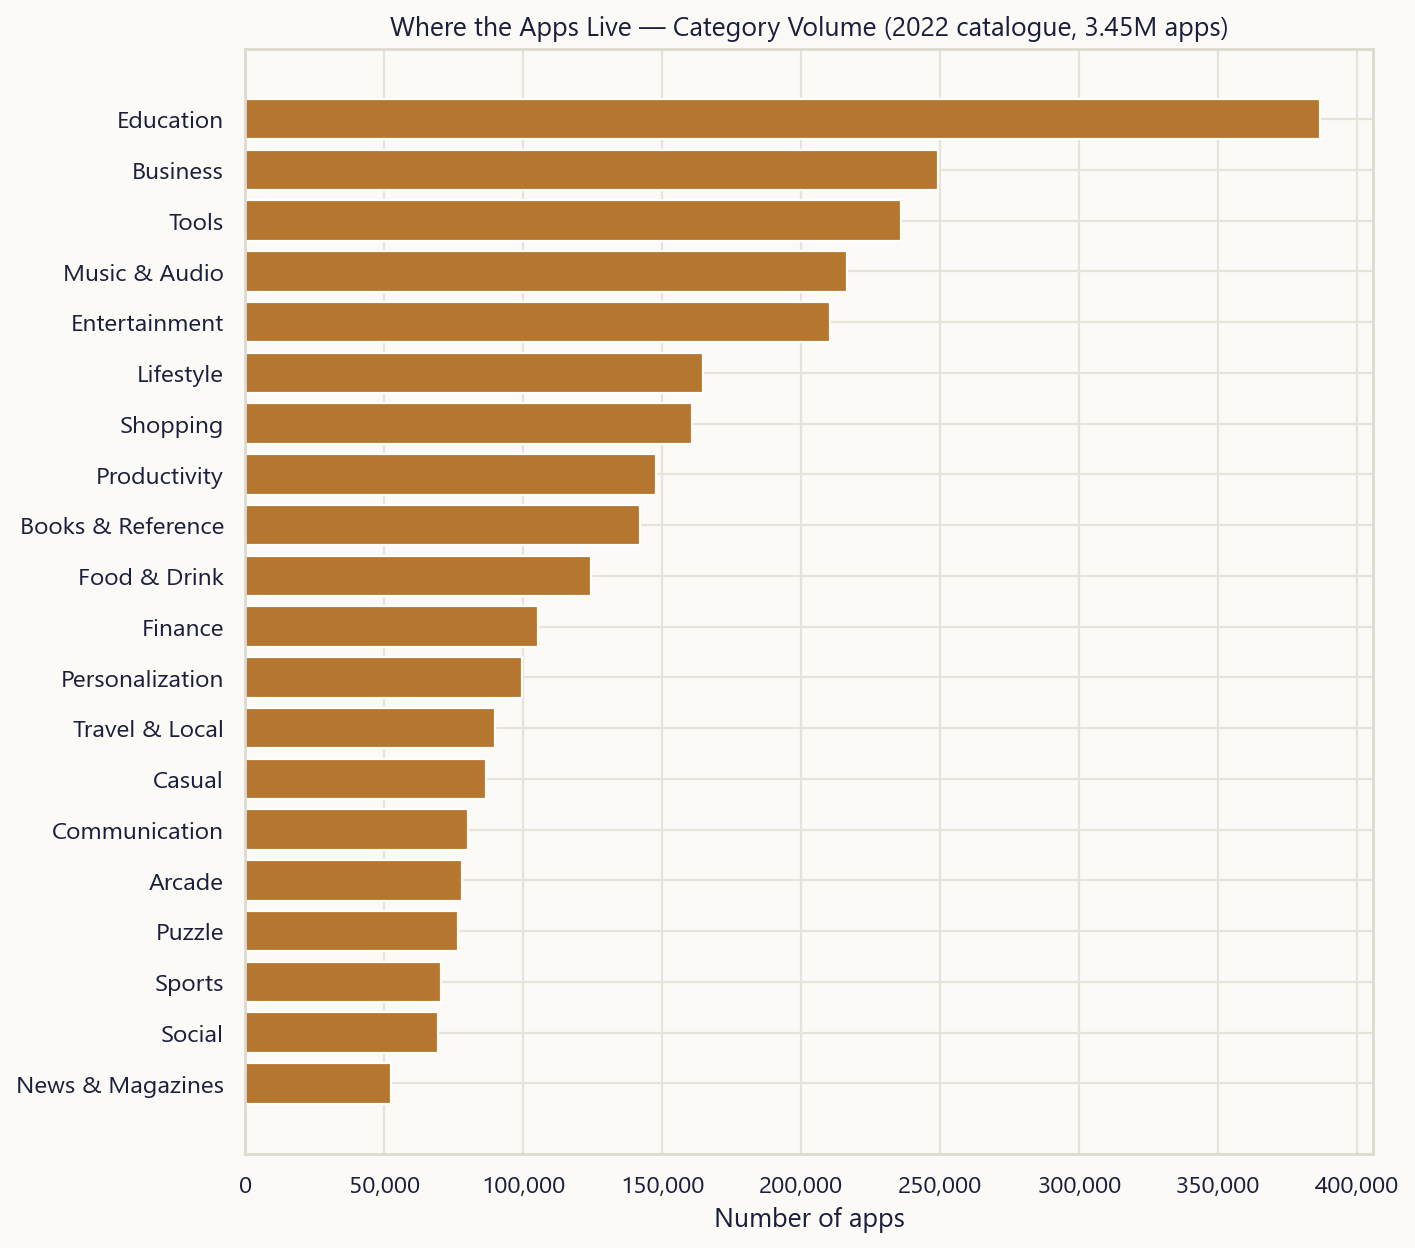
Education alone carries 386,518 apps in the 2022 archive. The top handful of categories (Education, Business, Tools, Music & Audio, Entertainment) absorb a disproportionate share of everything ever published.
Where big tech already owns the category
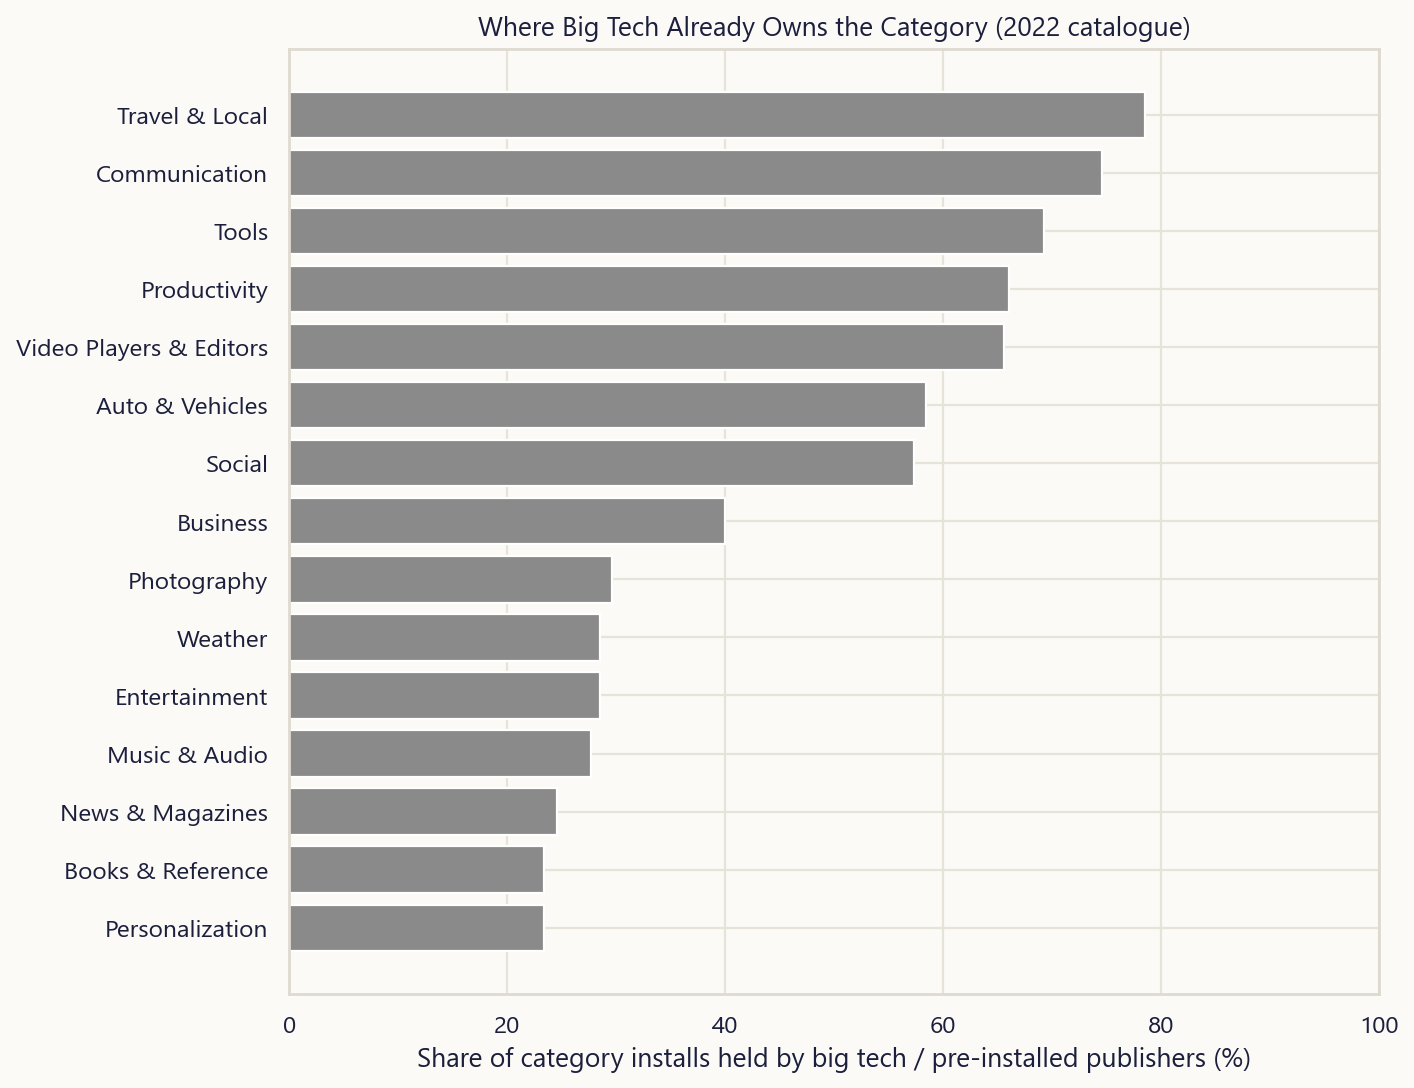
In Travel & Local, big tech and pre-installed publishers alone hold 78.6% of all installs: one or two players with a structural head start, not a crowded market. This is the reason every competition metric in the analysis excludes them.
The opportunity matrix: competition vs. demand vs. monopoly
Every category plotted on three axes at once: how many apps compete for attention, how much demand exists per app, and how much of that demand the top 3 apps already own (bubble size). Defaults to every publisher; click "Indie developers only" in the legend to swap in the big-tech-excluded view.
Four years on: category momentum is shifting
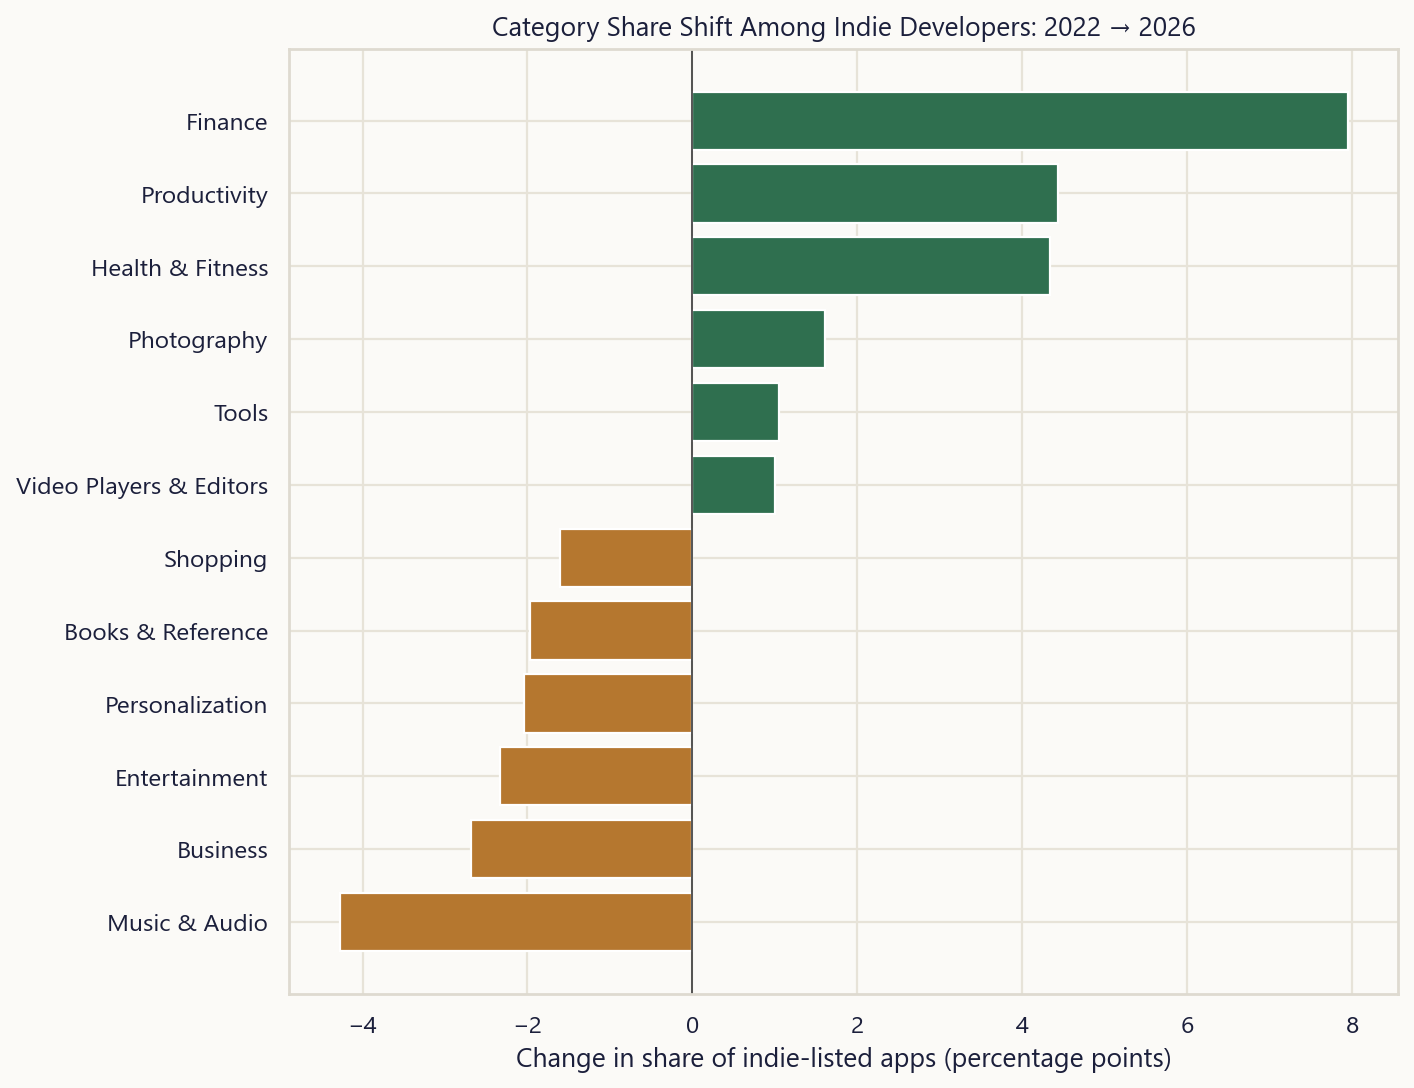
Comparing each category's share of indie listings in 2022 against 2026 isolates where independent publishing activity is actually moving: a momentum signal, not an installs one.
The business model changed underneath the store
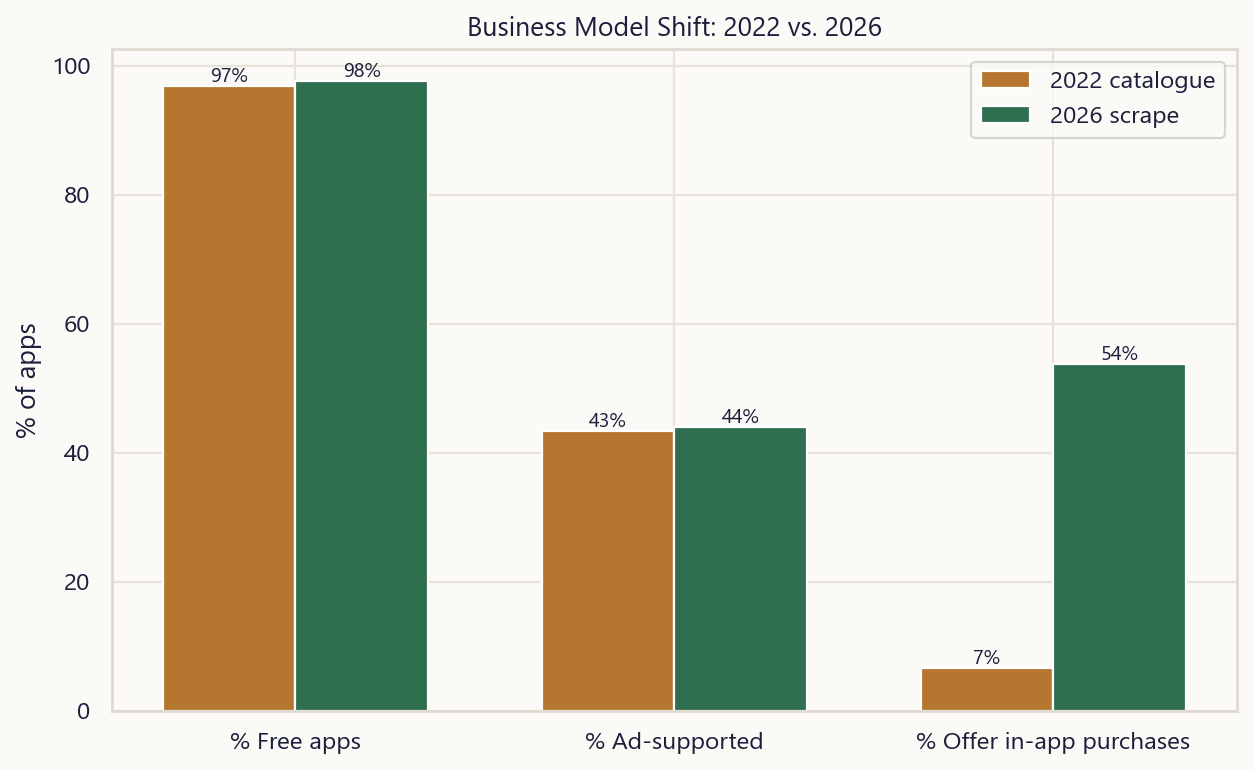
Free apps went from 96.9% to 97.7% of the catalogue, and pure paid apps are now a rounding error at 2.3%. Purely free is a minority strategy today (29.7%): hybrid ads-plus-in-app-purchases (29.2%) and IAP-only (24.1%) between them define how most current apps actually make money.
Rating distribution: 2022 vs. 2026
Normalized star-rating distributions for both eras, hover to compare bin heights directly. In the 2022 archive, 87% of all 3.45 million apps never received a single rating, so "the average rating" across the whole archive is close to meaningless; among apps that did get rated, the average is a healthier 4.0. Read the shift here as "what's competitive on the store today" rather than "apps got better": the 2026 scrape is biased toward live, currently-ranking survivors.
Every app in the 2026 catalogue, hover for the real name
All 11,176 apps, one dot each, positioned by installs and rating. Nothing is text-labeled on the chart itself so all of them stay visible; hover any dot for the real app name, developer, and category. Amber diamonds are big tech: 1.6% of the apps, 64% of the installs.
Popularity doesn't buy love
Every app's rating count plotted against its star score. There's close to no correlation: apps with a handful of reviews are just as likely to sit at 4.5 stars as apps with millions. Rating volume is not a proxy for quality.
Best and worst rated categories
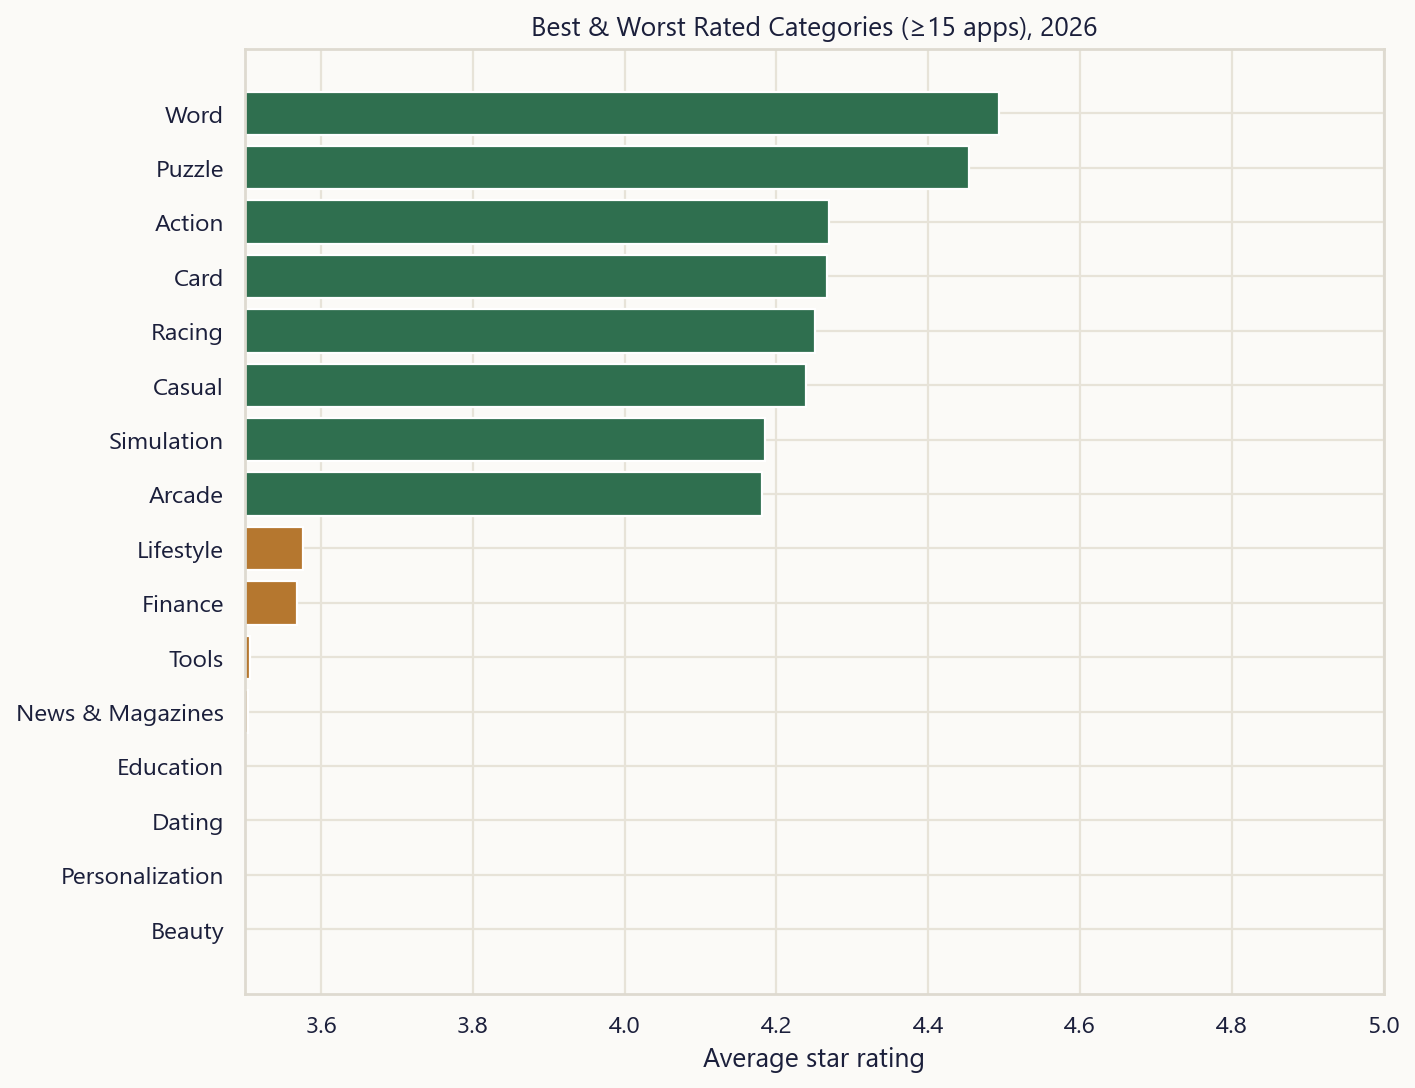
Word (4.49★ average) sits at the top of the 2026 catalogue, Beauty (2.81★) at the bottom, minimum 15 apps each. Utility-first categories tend to out-rate categories where user expectations are harder to meet consistently.
Content rating skews heavily toward 'Everyone'
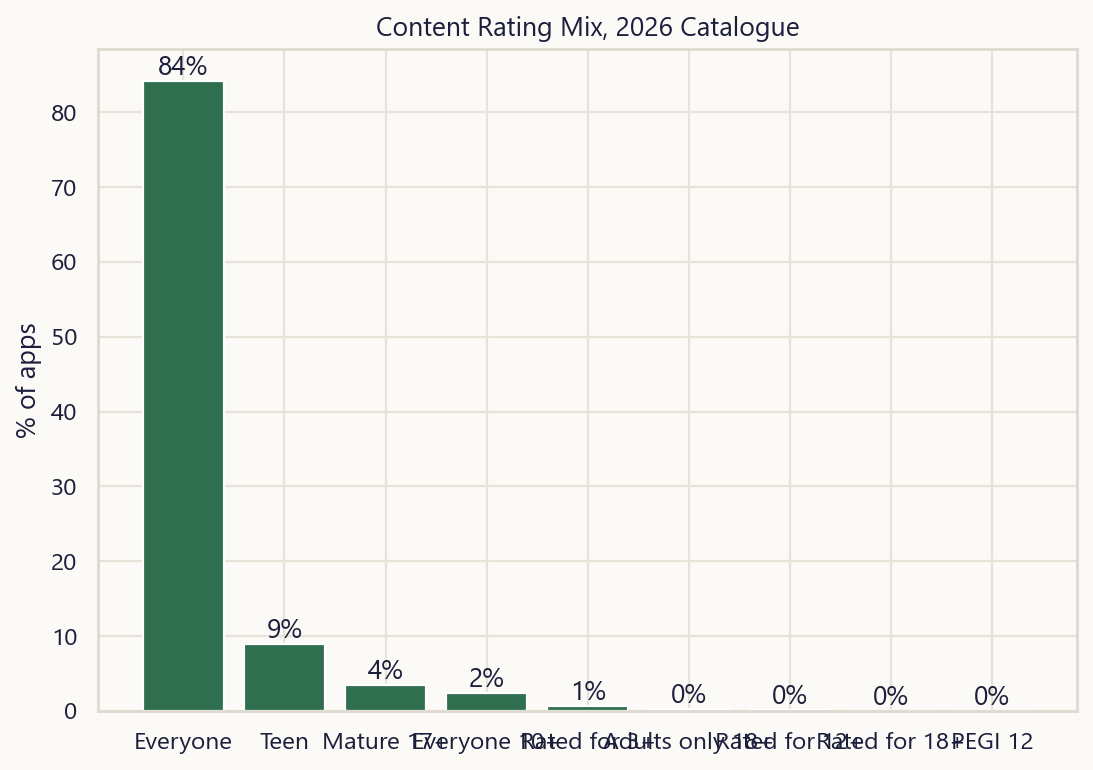
84.2% of the live 2026 catalogue is rated Everyone, with Teen a distant second at 9.0%: the store's center of gravity is mass-market, not niche or mature content.
Revenue architecture across the biggest categories
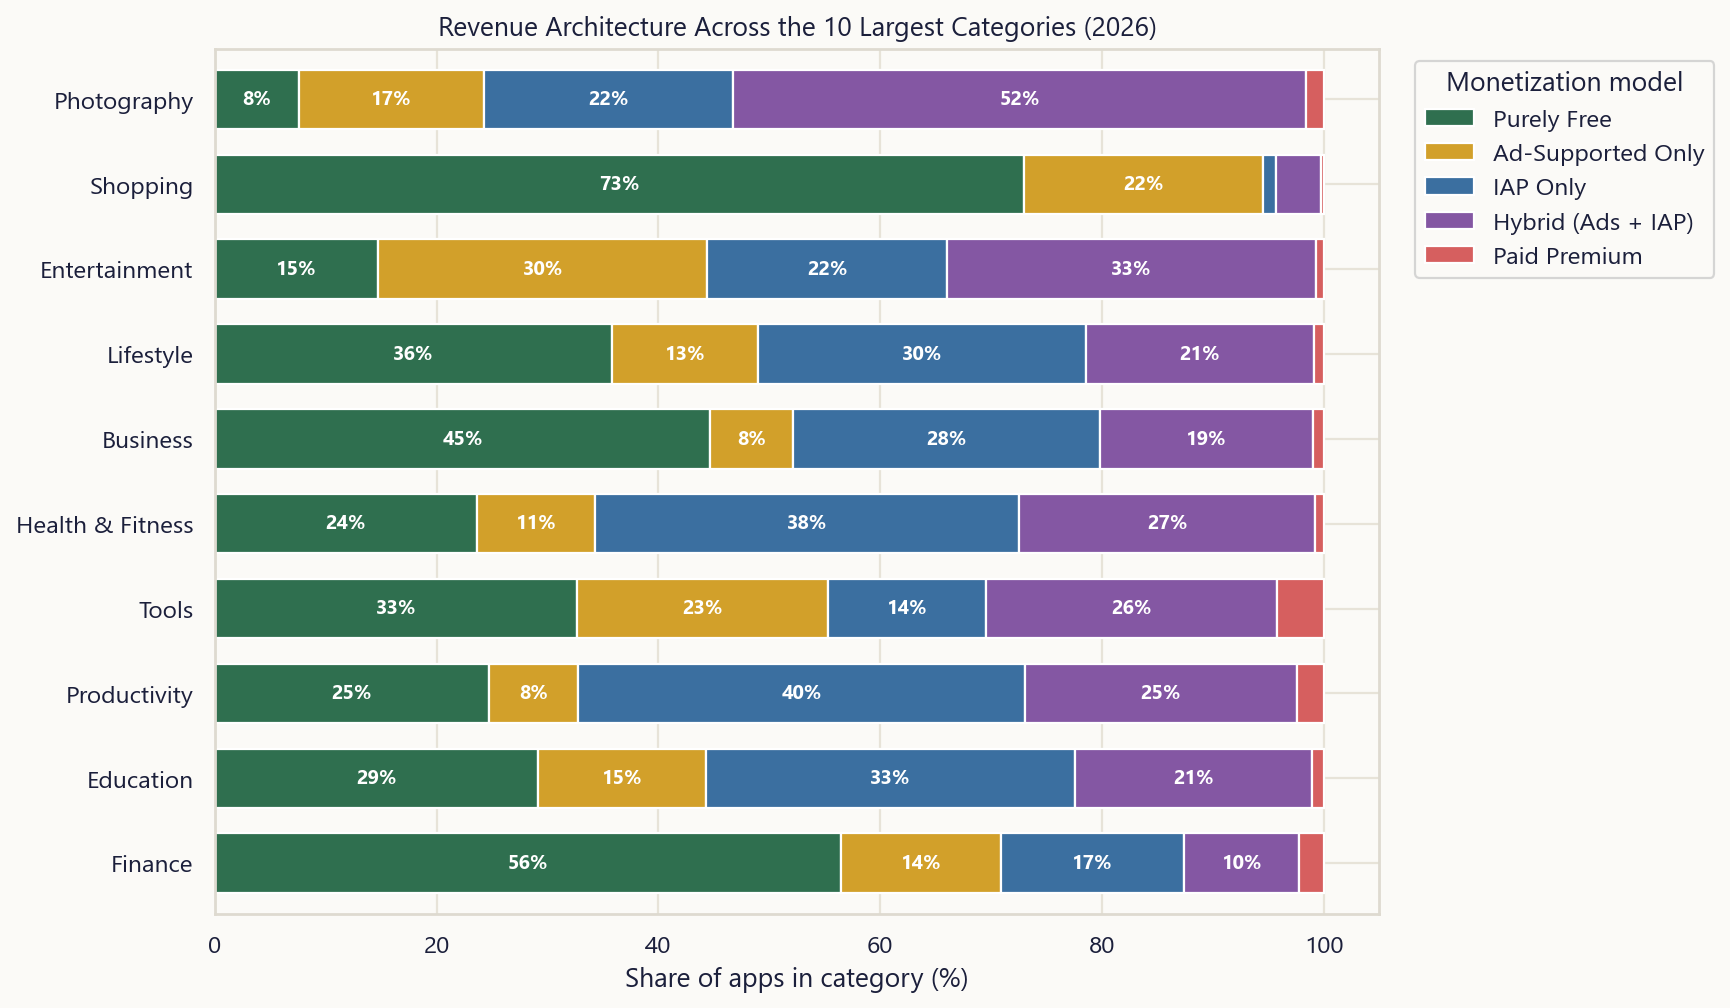
Monetization model share (purely free, ads-only, IAP-only, hybrid, paid) across the ten largest 2026 categories. Games and entertainment lean hard into hybrid ads-plus-IAP; utilities skew toward ads-only or IAP-only.
What's left of paid apps costs more now
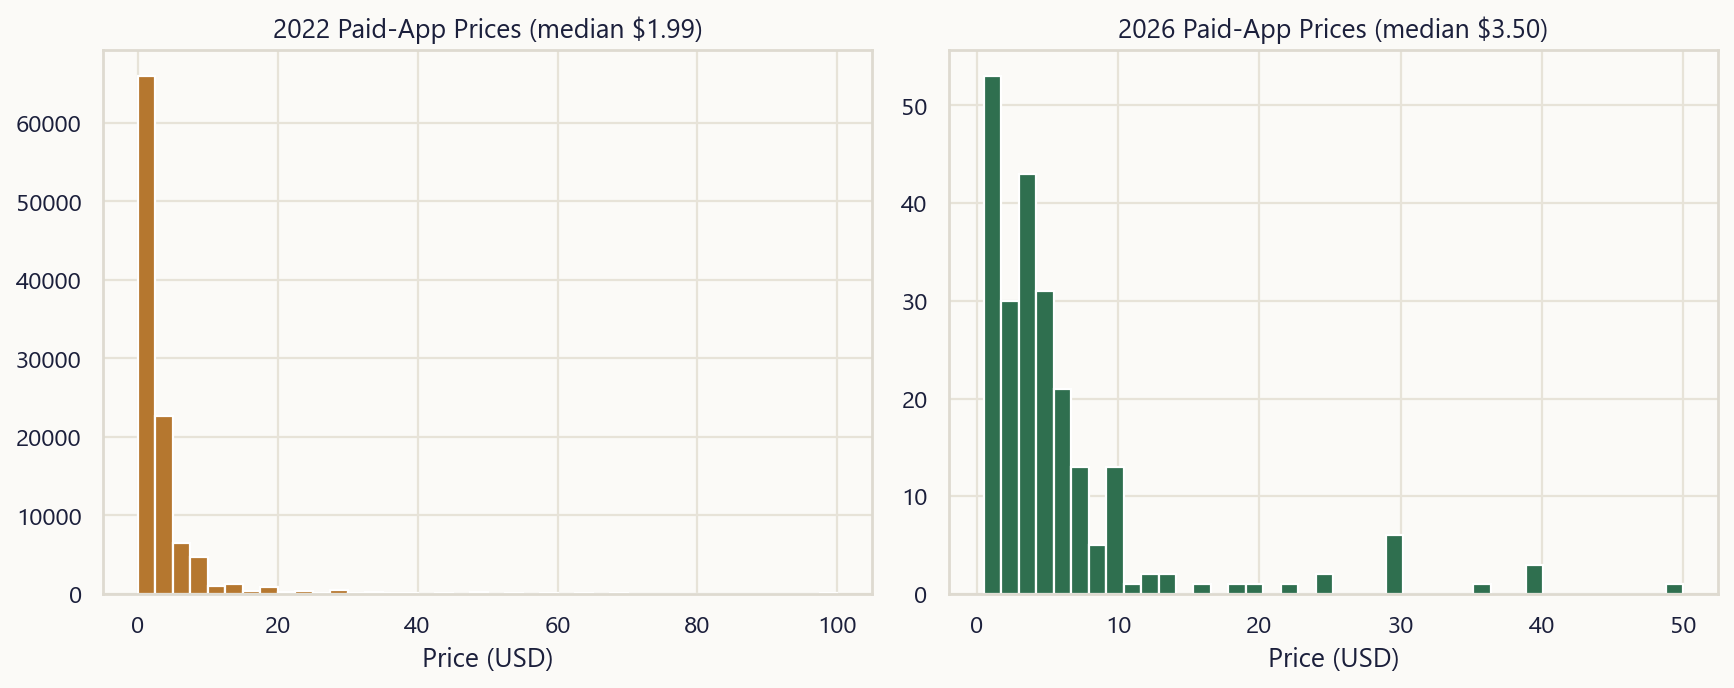
Median price for paid apps nearly doubled, $1.99 in 2022 to $3.50 in 2026, even as the share of apps charging anything at all kept shrinking. The paid tier that survives looks like a deliberate niche, not a dying default.
Big tech holds 64% of 2026 installs, and it's still winner-take-most without them
Install inequality among developers. Grey is every developer, green is indie-only (click the legend to toggle). Strip big tech out and the Gini coefficient barely moves, 0.99 to 0.92 in 2026: a real indie winner-take-most dynamic, not just a big-tech artifact.
Top developers by total installs
The largest publishers on the 2026 catalogue. Buttons in the top-right switch between the full publisher list and indie-only, since most developers aren't competing with the giants: 86% of indie developers have shipped exactly one app.
A decade of publishing, cohort by cohort
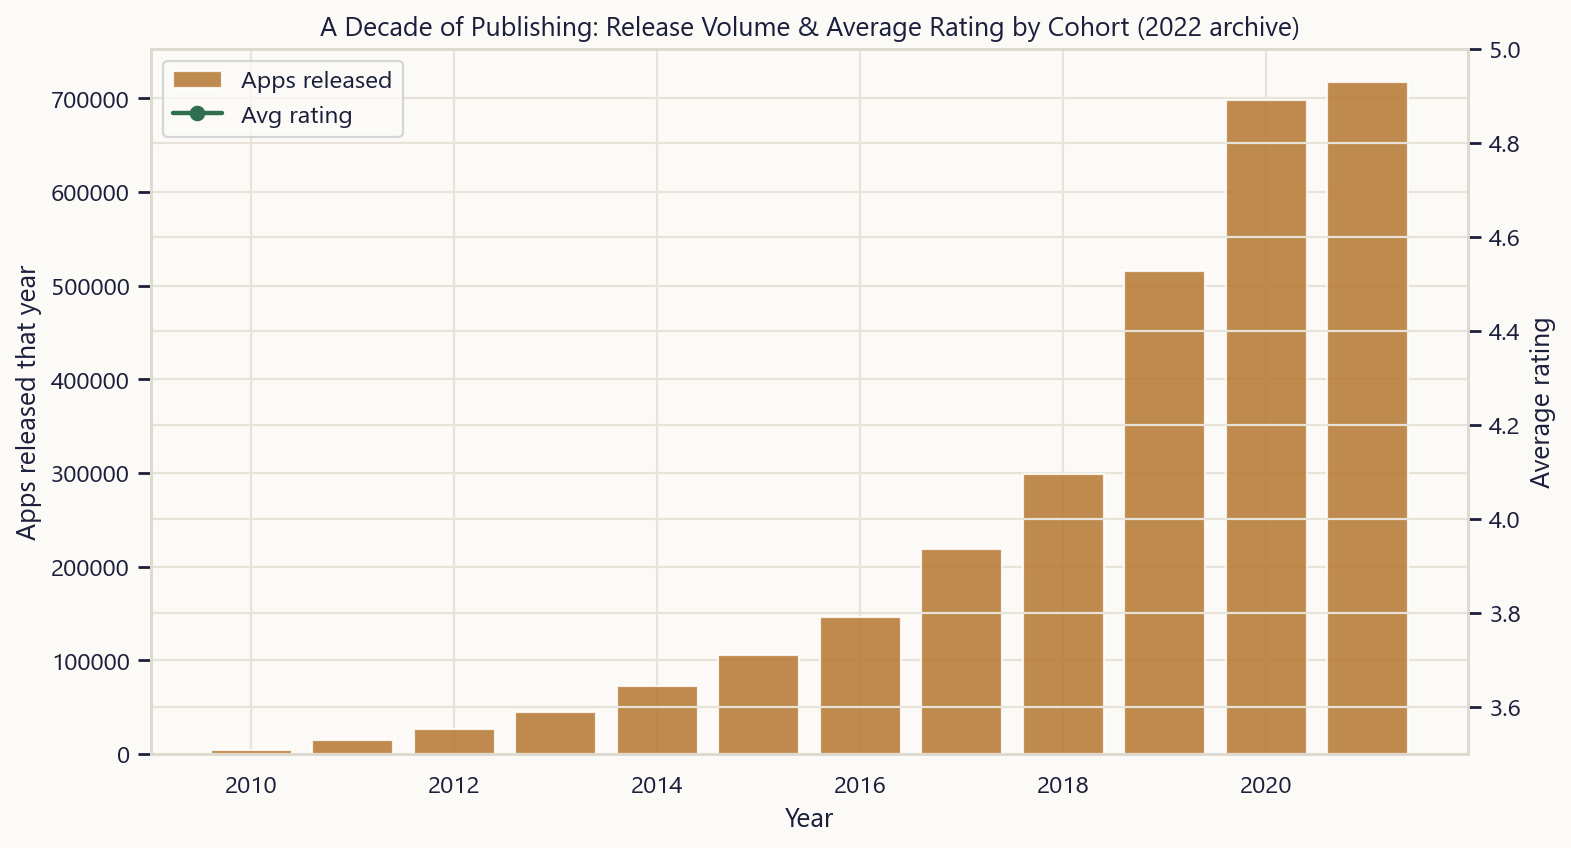
Release volume and average rating by year, 2010 to 2021, from the 2022 archive. Publishing activity peaked years before the archive was collected and has been tapering in the most recent cohorts since.
How recently have live apps been updated?
Time since last update across the current live catalogue. 54% were touched within the last month; only 7% haven't been updated in over a year. An app still shipping updates is, at minimum, still worth someone's time.
Same apps, different verdicts by country
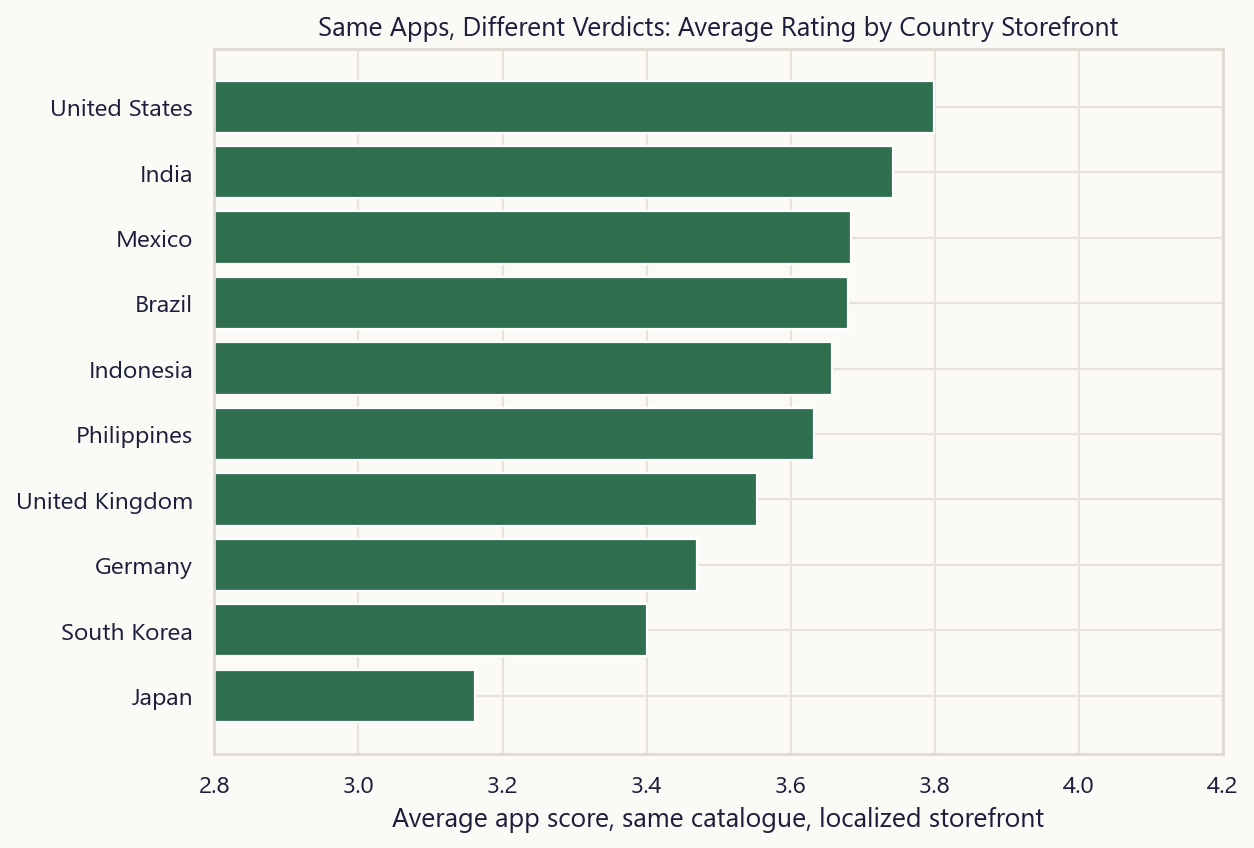
The identical 2026 catalogue, scored across ten localized storefronts: US users rate most generously (3.80★ average), Japan the toughest (3.16★), a pure localization effect worth remembering before treating any single region's rating as universal.
Which categories dominate the curated charts
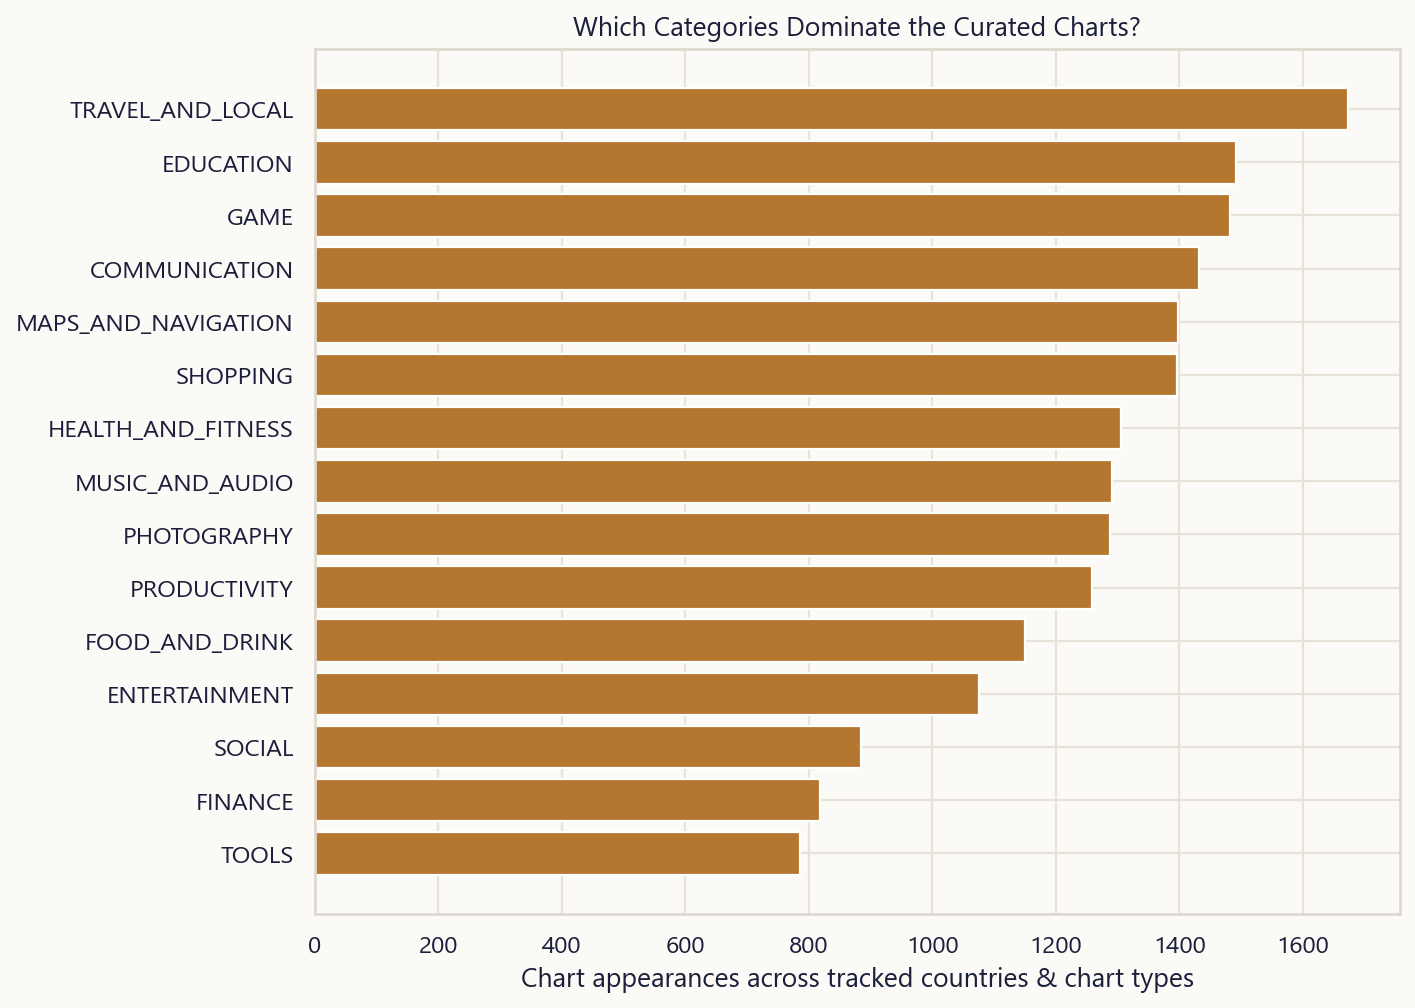
Travel & Local, Education, and Games show up most often across every tracked top-grossing/top-selling chart position: outsized editorial placement independent of raw category size.
Keyword competitiveness: search volume vs. result crowding
Bubble size is the number of distinct apps competing for a search keyword; lower on the y-axis means buried deeper in results. Broad terms bury any one result under hundreds of competitors; narrow, intent-specific terms surface a much smaller field.